Contour Diagram |
  
|
Contour Diagram |
|
Click Analysis Results > Contour Diagram to view the contour diagram on the model itself. This opens the Contour Diagram dialog.
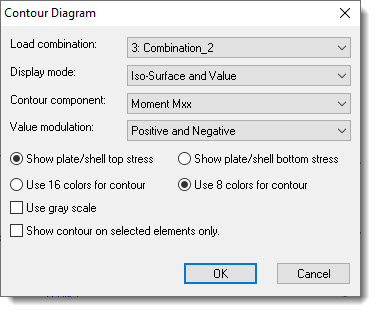
Select the desired Load Combination.
Select the display mode, where the options include diagrams with values, diagrams only, values only, or erase.
Select the Contour component, where the options include displacements, moments, bending shears, forces, and many types of plate stresses.
The final options include:
•Show plate/shell top stress or bottom stress
•Use 8 or 16 colors for contours
•Use gray scale or color
•Show contours on selected elements or on all elements

