F-08 (Response Spectrum Analysis of 4 Story Shear Building) |
  
|
F-08 (Response Spectrum Analysis of 4 Story Shear Building) |
|
Objective
To verify the results of response spectrum analysis of a shear building using beam elements
Problem Description
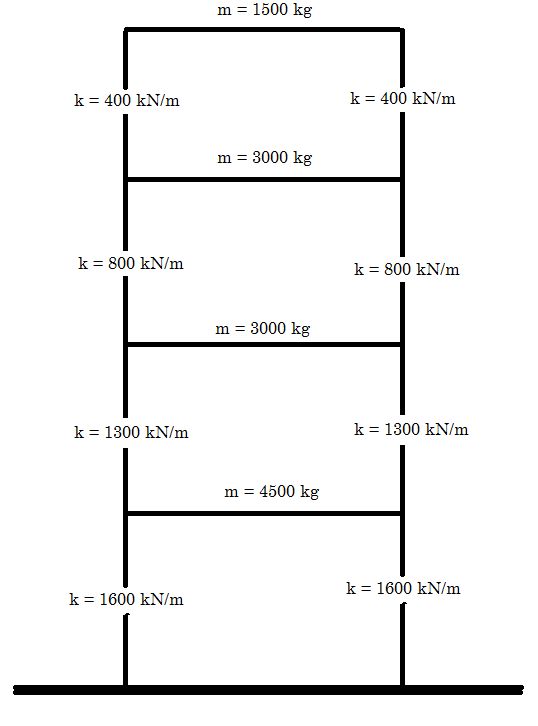
A 4-story shear building [Ref 1] with corresponding mass and stiffness info shown below.
The response spectrum is defined below (from Create > Generate Loads > Response Spectra Library menu).
Period (sec) |
Spectral Acceleration (g) |
0.0 |
0.15 |
0.1 |
0.18 |
0.2 |
0.25 |
0.3 |
0.38 |
0.4 |
0.50 |
0.5 |
0.50 |
0.6 |
0.40 |
0.8 |
0.32 |
1.0 |
0.25 |
1.2 |
0.19 |
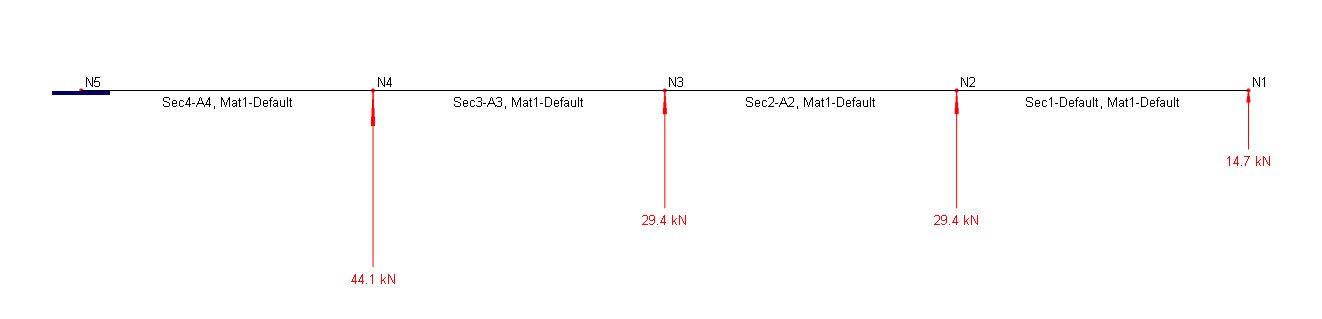
We will use four 1m steel beam elements, with sectional area of A1 = 4 mm2, A2 = 8 mm2, A3 = 12 mm2 and A4 = 16 mm2. E = 199.948 KN/mm2, v = 0.3. The axial stiffness EA/L will match the shear building column stiffness. We will use very large values for other section properties such as Iz, Iy, J, Ay, Az. This effectively allows us to focus beam element behavior in axial direction only.
We will apply vertical loads F1 = 14.7 KN, F2 = 29.4 KN, F3 = 29.4 KN and F4 = 44.1 at the four free nodes. These forces will be converted to equivalent masses by the program during frequency/response spectrum analysis.
Results
The following lists different results by ENERCALC 3D against the reference [Ref. 1].
Vibration Periods (sec)
|
ENERCALC 3D |
Reference |
Mode 1 |
0.5788 |
0.5789 |
Mode 2 |
0.2594 |
0.2595 |
Mode 3 |
0.1873 |
0.1873 |
Modal Displacements (cm)
Node |
ENERCALC 3D |
Reference |
||||
Mode 1 |
Mode 2 |
Mode 3 |
Mode 1 |
Mode 2 |
Mode 3 |
|
1 |
5.1930E+00 |
-3.9987E-01 |
5.8228E-02 |
5.19545e+00 |
-4.00257e-01 |
5.82355e-02 |
2 |
4.0459E+00 |
3.9837E-02 |
-6.4594E-02 |
4.04779e+00 |
3.98752e-02 |
-6.46441e-02 |
3 |
2.5786E+00 |
2.1588E-01 |
1.0244E-02 |
2.57982e+00 |
2.16095e-01 |
1.03938e-02 |
4 |
1.2207E+00 |
1.7499E-01 |
4.5731E-02 |
1.22125e+00 |
1.75157e-01 |
4.56209e-02 |
Inertia Forces (N)
Node |
ENERCALC 3D |
Reference |
||||
Mode 1 |
Mode 2 |
Mode 3 |
Mode 1 |
Mode 2 |
Mode 3 |
|
1 |
9.1746E+03 |
-3.5167E+03 |
9.8232E+02 |
9.18127e+03 |
-3.52106e+03 |
9.83037e+02 |
2 |
1.4296E+04 |
7.0070E+02 |
-2.1794E+03 |
1.43063e+04 |
7.01546e+02 |
-2.18364e+03 |
3 |
9.1113E+03 |
3.7973E+03 |
3.4565E+02 |
9.11798e+03 |
3.80201e+03 |
3.55155e+02 |
4 |
6.4698E+03 |
4.6169E+03 |
2.3145E+03 |
6.47450e+03 |
4.62254e+03 |
2.30532e+03 |
Base Shear Forces (N)
|
ENERCALC 3D |
Reference |
Maximum Likely (SRSS) |
3.9478e+004 |
3.951e+04 |
Maximum Possible (ABSSUM) |
4.6113e+004 |
4.614e+4 |
Comments
The results given by ENERCALC 3D are very close to the referenced values. We did not enter nodal masses directly. Therefore, we need to make sure nodal forces are converted to masses before frequency analysis (Analysis > Frequency Analysis).
Reference
[1]. “Earthquake Response Spectrum Analysis of 4 Story Shear Building”, 1996, Mark Austin, Department of Civil Engineering, University of Maryland
