A Tour of the Graphical User Interface |
  
|
A Tour of the Graphical User Interface |
|
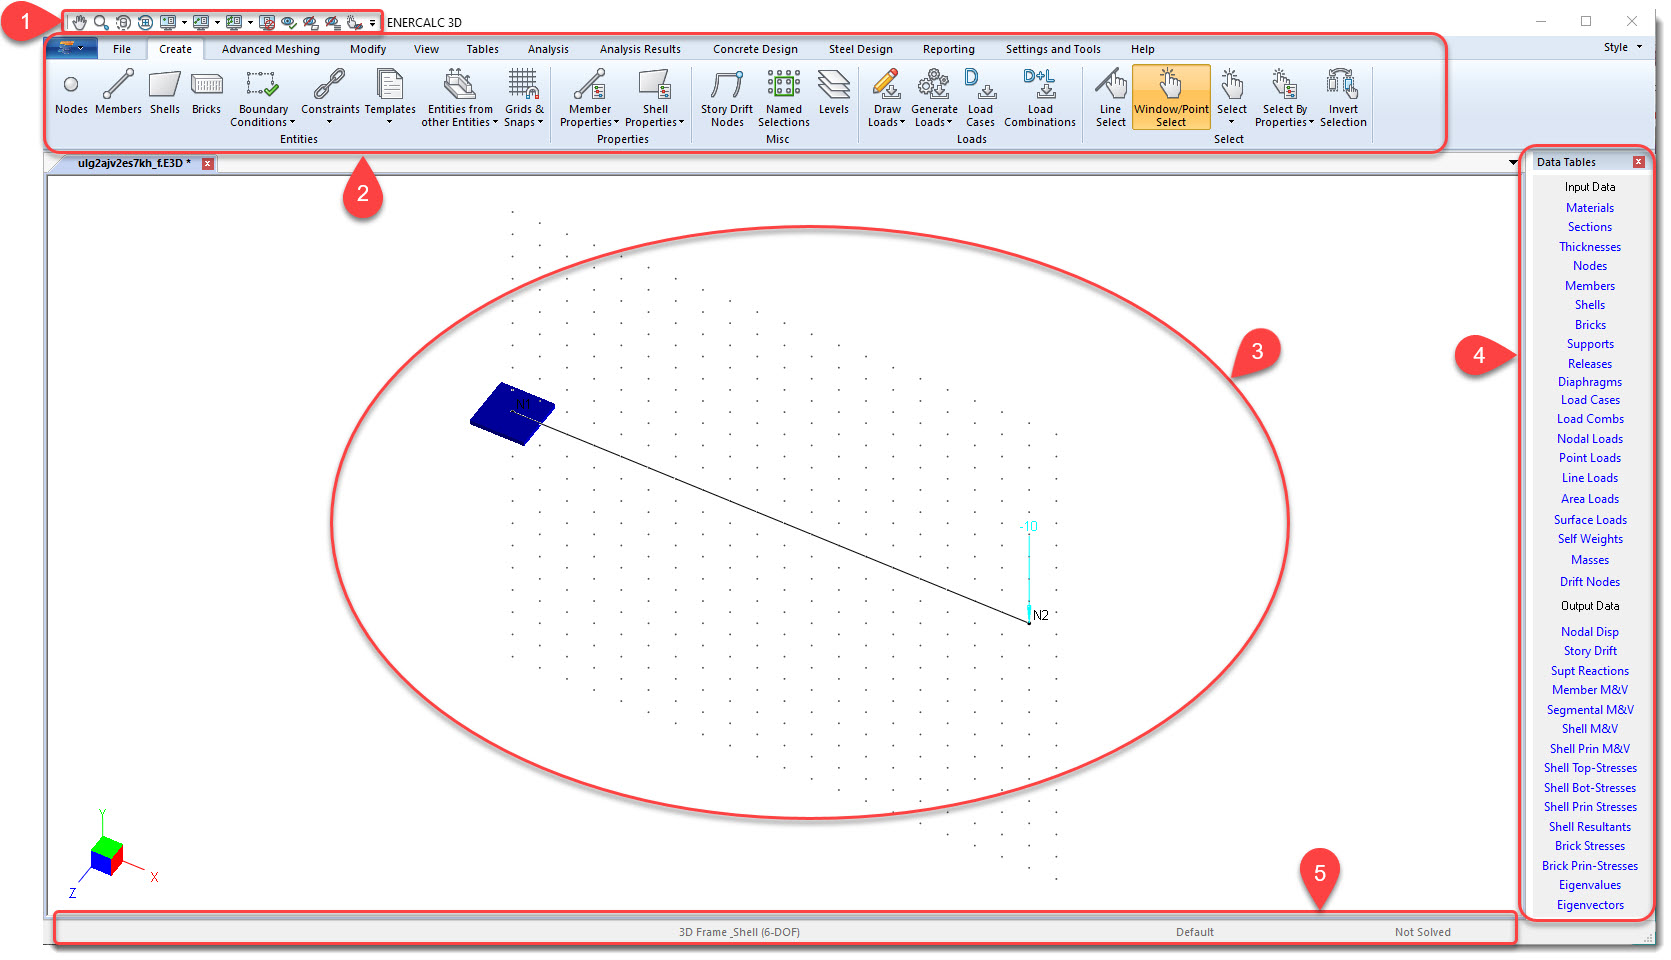
The graphical user interface can generally be broken into five major areas:
1. Quick Access Toolbar: Offers frequently used tools in plain sight with just a single click.
2. Ribbon bar: Organizes all available tools into logical categories.
3. Windows: Used to display the model and to issue graphical commands like adding, selecting, deleting and querying model geometry.
4. Data Tables Toolbar: Offers quick access to input and output data tables without navigating to the Tables tab in the ribbon.
5. Status bar: Used to provide feedback to the user on the status of the program and the model.
Parts of the graphical user interface are user configurable through commands such as:
Settings & Tools > Graphic Scales: Used to establish the scale of many items that are displayed on the screen.
Settings & Tools > Colors: Used to establish the color of the background and many items that are displayed on the screen.
Settings & Tools > Toolbar: Used to toggle the display of the Data Tables toolbar.
